Research · The Advisor Capacity Study 2026
The job kept growing. Capacity didn’t.
A brief study of the past and a glimpse into the future, drawn from SEC Form ADV filings of 7,132 wealth-management RIAs. Scroll to read.
01 Part one · A brief study of the past
What is the job of a financial advisor?
The job
Building — and keeping — the client relationship.
The trust that helps clients reach financial security and their personal goals. Excellent advice. Excellent service.
Not the tasks
- Taking meeting notes
- Running Monte Carlos
- Preparing decks
- Chasing documents
- Opening accounts
The job evolved.
The tasks multiplied.
What it takes to serve one client relationship, cumulative by decade.
1970s
Stockbroker
1980s
Wirehouse
1990s
RIA
2000s
Planner
2010s
Wealth manager
2020s
Family office
02 The tools grew with it
2018
189
solutions · 29 categories
Every new task got its own tool. Each one does its task well.
Source: Kitces AdvisorTech Solutions Map, April 2018 and April 2025 editions, as reported by WealthManagement.com (Apr. 10, 2025).
03 And the business?
So what changed for the business? Nothing.
2018
41
clients per person on staff · 3,534 firms
2026
45
clients per person on staff · 7,132 firms
Medians across SEC-registered RIAs classified as wealth managers (majority of RAUM from individuals, Form ADV Item 5.D). Staff = all employees (5.A); clients = 5.D + 5.C. Source: entropyFA analysis of SEC Form ADV Part 1A — 2018 historical extracts and the IAPD feed, July 2026. Methodology
Tech spend per person +31%.
Output −16%.
Both market-adjusted, in 2018 terms · Index, 2018 = 100
+31%
Tech spend per person
~$14K → ~$18K, est. at a 1% fee
−16%
AUM per person
2018–2026, market-adjusted
So what gives?
The job kept growing. The stack nearly tripled. Clients per person: the same line since 2018. AUM per person: down 16%, market-adjusted. Profits: borrowed from the market.
Sources: entropyFA Form ADV analysis; Kitces AdvisorTech map; The Ensemble Practice 2025; InvestmentNews 2025.
04 Look around
You became the integration layer.
Every tool holds a piece of the client. Every handoff depends on someone carrying the context.
10+ systems reconciled by hand
1 person holding the whole picture
The specialists said, “We integrate.”
Each does one task well. None does the whole job. Eight tools make twenty-eight connections — each one a place for context to fall through.
8 tools · 28 connections
Then everyone bolted on AI.
An assistant inside every tool, each seeing one slice of the client. Or an AI layer on top of copied data, while the tools still own the work.
After the answer, who does the work?
Your people. Same as before.
Why bolted-on AI falls short
- 01
No full client context
Each assistant sees a slice. The layer sees copies. Nothing holds the whole household.
- 02
Your client data leaves your control
Prompts and client data are often stored by default, under someone else’s retention terms.
- 03
Little control over how it behaves
You don’t choose the model, the rules or how it follows your firm’s process.
- 04
Your process depends on someone else’s priorities
Providers set the terms and change the policies — and some now compete with their own customers.
05 The electric factory
New technology requires rethinking the way work is done.
When electric power arrived in the 1880s, factories ran on steam or water. A single engine or water wheel turned long shafts along the ceiling, and leather belts carried power down to every machine. The first owners to electrify simply put an electric motor where the steam engine had stood. Later, they gave each machine a motor of its own. The shafts came down, but in the old buildings the floor plan stayed: machines sat where the old shafts had put them, and work moved through the building the way it always had. For decades, electricity barely moved factory productivity.
The payoff came when manufacturers stopped asking how to power the old factory and started asking how the work should flow. Ford’s moving assembly line, in 1913, showed what was possible. Through the 1920s, factories were rebuilt as single-story plants laid out in the order work was done, and productivity in American manufacturing surged. Economists who later studied the episode drew a lesson that held again for computers: a transformative technology pays off only when the work itself is redesigned around it.
-
01 Bolted on
An electric motor where the steam engine stood. Same shafts, same belts, same floor.
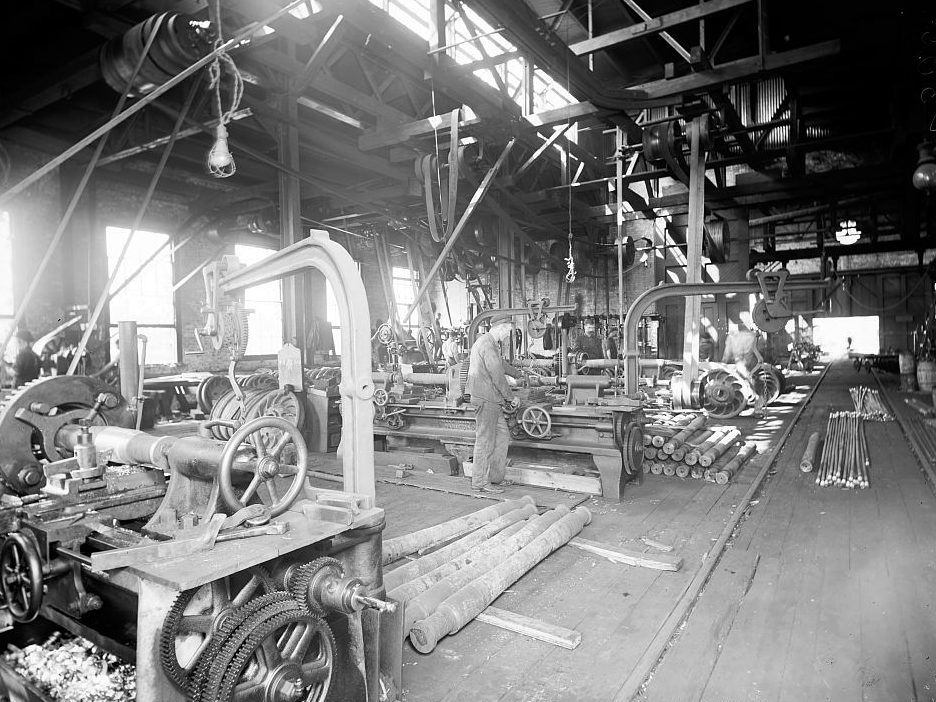
Little changed.
Line-shaft machine shop, Merchants’ Despatch Transportation Co., c. 1900. Detroit Publishing Co., Library of Congress.
-
02 A motor on every machine
Each machine got its own motor and ran a little better. The floor, and the way work moved through it, stayed the same.
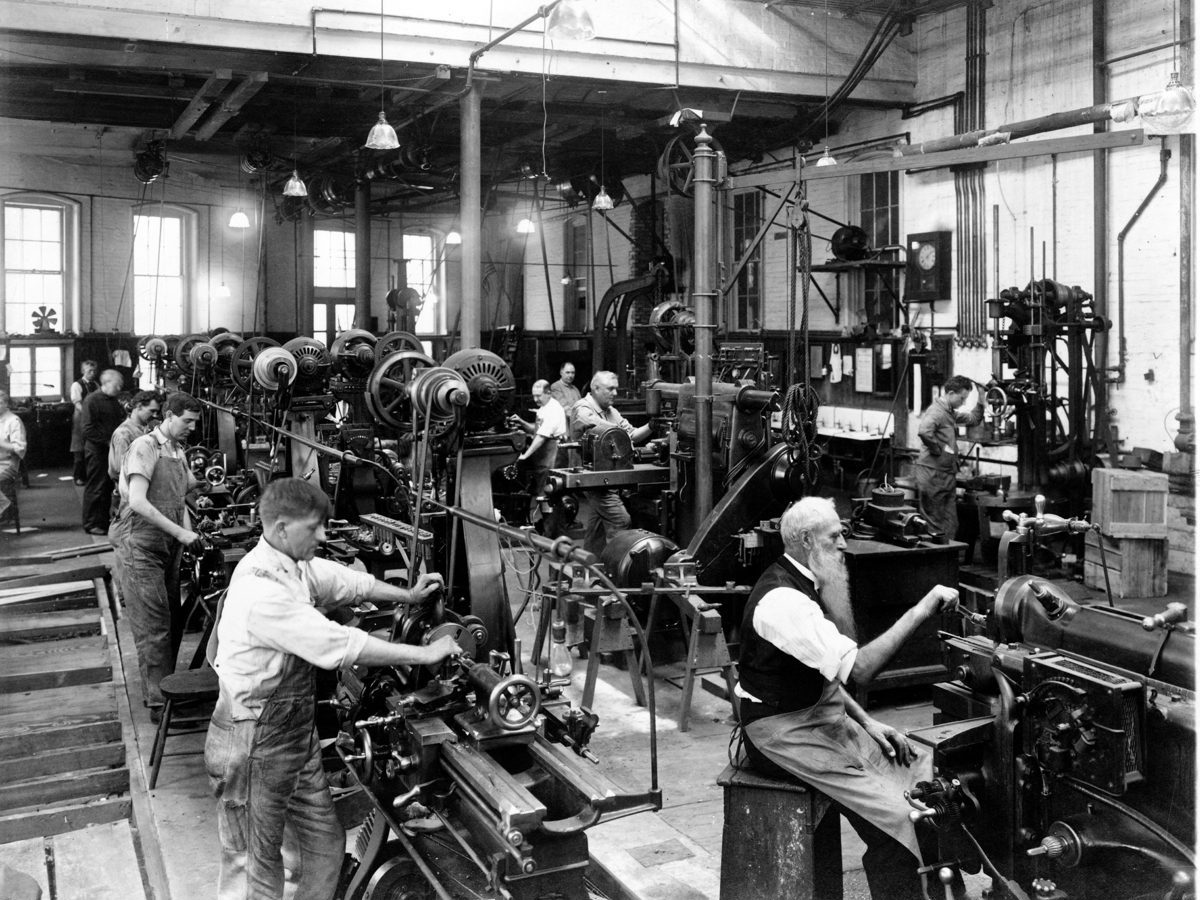
Still little changed.
A motor on each lathe, Government Printing Office machine shop, Washington, D.C., photographed 1909 or later. National Photo Company Collection, Library of Congress.
-
03 The floor redesigned
Factories were rebuilt around how the work flows: Ford’s moving line in 1913, then new single-story plants through the 1920s.
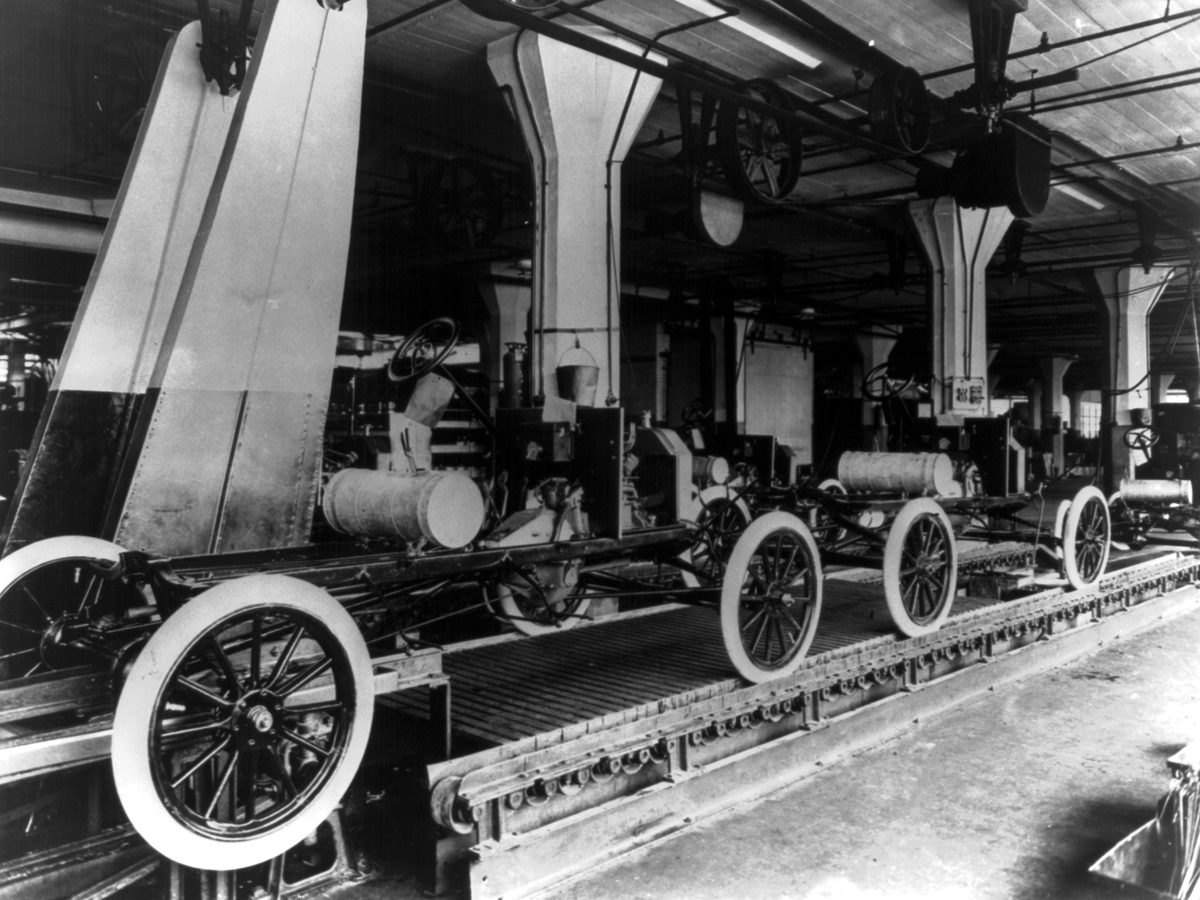
Productivity finally moved.
Model T assembly line, Ford Highland Park plant, 1913. Library of Congress.
Adding AI to every tool is a motor on every machine.
Useful, and not enough. The gain comes from redesigning the work around one household record and one agent. It happened in coding, then in law. Financial advice is next. Purpose-built beats bolted-on.
06 Part two · A glimpse into the future
The ideal: a purpose-built agent that works like a member of your team.
Across the whole relationship. Private, compliant and customized to your firm.
- Prospect
- Win
- Onboard
- Serve year after year
Most tools stop at the win. Most of the job is serving.
A Thursday review, start to finish 01 / 06
It starts before you do.
Entropy runs scheduled work overnight and leaves a brief of what needs you today.
Ask the way you’d ask a colleague.
Plain language. It already knows which household, which email and which meeting you mean.
It works from the whole household.
People, accounts, trusts, meeting history, email and your firm’s own policies — one record, not copies stitched together from ten systems.
It does the analysis, not just the answer.
Agents reason; code executes. Tax projections and Monte Carlo run in a calculation engine, so every number traces back to its inputs.
It produces the work.
The review deck, the agenda and the follow-up email — in your firm’s format, ready to edit.
You stay the advisor.
Nothing reaches a client until you approve it. Every source, calculation and edit is on the record for compliance.
The entropyFA workspace with fictional households from our demo firm. Figures are examples, not results.
The result: your tech stack, consolidated.
- Planning
- CRM
- Note taker
- Tax analysis
- Estate
- Research
- Proposals
- Risk tolerance
- Document vault
- Onboarding
One platform
One agent · one household record
10 → 1
subscriptions
45 → 0
tool-to-tool connections
Better advice. Better service. Same price or lower.
Categories shown for illustration. Reporting, rebalancing and billing are on the roadmap. Price compared with the subscriptions replaced; adoption is phased.
The goal: a step up for every firm.
Entropy, resolved.
One agent · one household record · every stage